Google Charts in Java: add a chart to a webforJ app

Sooner or later, most business apps need a chart: revenue by month, orders by region, tickets by status. In a Java web app that often means a detour into JavaScript charting libraries, a second build, and code that passes data back and forth between the two.
Google Charts in Java can skip that detour. With webforJ, a chart is one more component in your view. You pick a chart type, hand it your rows and a few options, and it draws itself in the browser while your code stays in Java. This guide builds a chart step by step, from the first pie chart to live updates and click handling.
The Google Charts documentation has live, interactive samples you can click through in the browser, with the full Java source next to each one.
Add the dependency
GoogleChart ships as its own artifact. Add it to your pom.xml next to the webforJ dependencies:
<dependency>
  <groupId>com.webforj</groupId>
  <artifactId>webforj-googlecharts</artifactId>
  <version>${webforj.version}</version>
</dependency>
There is no JavaScript to install. The component loads the Google Charts library in the browser for you.
Create the chart
Pass a chart type to the constructor, give the chart a size, then set the data. The first row is the header. Every row after it is one data point. This example is the pie chart from the docs:
GoogleChart chart = new GoogleChart(GoogleChart.Type.PIE);
chart.setStyle("width", "100vw").setStyle("height", "100vh");

List<Object> data =
    List.of(
        List.of("Region", "Sales"),
        List.of("North America", 500),
        List.of("Europe", 300),
        List.of("Asia", 200),
        List.of("Latin America", 100),
        List.of("Middle East", 80),
        List.of("Africa", 60));
chart.setData(data);
Add the chart to any container, such as a Div or a FlexLayout. Without a size, the chart has no room to draw, so always set one. The chart is one of the components that ship with webforJ, so it combines with layouts, tables, and dialogs.
Pick a chart type
The type is a GoogleChart.Type value. You can also change it later with setType(). These are the values available:
- Comparing values:
COLUMN,BAR,COMBO,HISTOGRAM - Trends over time:
LINE,AREA,STEPPED_AREA,CANDLESTICK - Parts of a whole:
PIE,TREEMAP,SANKEY - Relationships:
SCATTER,BUBBLE - Schedules and maps:
GANTT,TIMELINE,CALENDAR,GEO - Other:
GAUGE,ORG,TABLE,WORDTREE
Each type expects its own column layout. A pie chart takes a label and a number. A scatter chart takes two numbers. The Google chart gallery shows the layout for each one.
Set options
Options are a Map<String, Object>. The keys are the Google Charts option names, so anything in the gallery reference works.
Map<String, Object> options = new HashMap<>();
options.put("title", "Monthly Revenue");
options.put("backgroundColor", "#EFEFEF");

// Apply the options to the chart
chart.setOptions(options);
Nested options, such as a legend position, are nested maps, and lists of values, such as colors, are Java lists.
If you keep options in a JSON file, parse them into a map with Gson and pass the result to setOptions(). The docs page shows that pattern.
Update the chart
You don't call redraw() after changing the data. setData(), setOptions(), setType(), and setSelection() all redraw the chart on their own. The chart also redraws when the browser window resizes.
To update the data, build a new list with the header row first and set it again. This is the core of the docs' redraw sample, where the user types new values into number fields and clicks a button:
List<Object> newData = new ArrayList<>();
List<String> columns = List.of("Category", "Number of Followers in Thousands");
newData.add(columns);

for (String category : categories) {
  NumberField valueField = valueFields.get(category);
  long value = Long.parseLong(valueField.getText());
  newData.add(List.of(category, value));
}

chart.setData(newData);
Changing the chart type works the same way: call setType() with another GoogleChart.Type and the chart redraws.
Call redraw() only when the container changes size without a window resize. Expanding a panel or dragging a sidebar are two examples.
Handle clicks
Add a selected listener to react when a user clicks a column, slice, or point. getSelection() returns the selection as a list. Each entry holds the row index of the clicked data point, and some chart types, such as a table, also add a column.
chart.addSelectedListener(event -> {
  List<Object> selection = chart.getSelection();

  if (!selection.isEmpty()) {
    System.out.println("Selected Row: " + selection.get(0));
  }
});
Use the row index to open a detail view, filter a table, or show a message about the clicked item. A chart also sits well beside KPI cards and a table, as in a Java admin dashboard.
Export the chart as an image
getImageUri() returns the chart as a base64 PNG. Call it after the chart has drawn, which is what the ready event tells you:
chart.addReadyListener(e -> {
  String imageUri = chart.getImageUri();
  // use it as the src of an image, or in an email
});
Checklist
- Add the
webforj-googlechartsdependency. - Create a
GoogleChartwith aGoogleChart.Type. - Set the data as a list of rows, with a header row first.
- Set a size, and add the chart to a container.
- Pass options as a map with
setOptions(). - Call
setData()again whenever the data changes. - Listen with
addSelectedListener()for clicks.
The full reference is on the Google Charts docs page. The FlexLayout docs cover placing a chart next to other components.
Frequently asked questions
Do I need to write JavaScript to use Google Charts in Java?
No. You set the type, data, and options from Java. The component loads and drives the Google Charts library in the browser.
Which chart types can I use?
The GoogleChart.Type enum lists them. It includes column, bar, line, area, pie, scatter, geo, gauge, gantt, timeline, and more.
Do I have to call redraw() after changing the data?
No. Setting the data, options, type, or selection redraws the chart. Use redraw() only for container size changes that don't trigger a window resize.
How do I get the clicked data point?
Use addSelectedListener(), then call getSelection() on the chart. It returns the selected entries, each with the row index of the clicked data point.
正在用 webforJ 构建项目?
与团队聊聊您的项目、迁移事宜,或 webforJ 是否适合您。
继续阅读
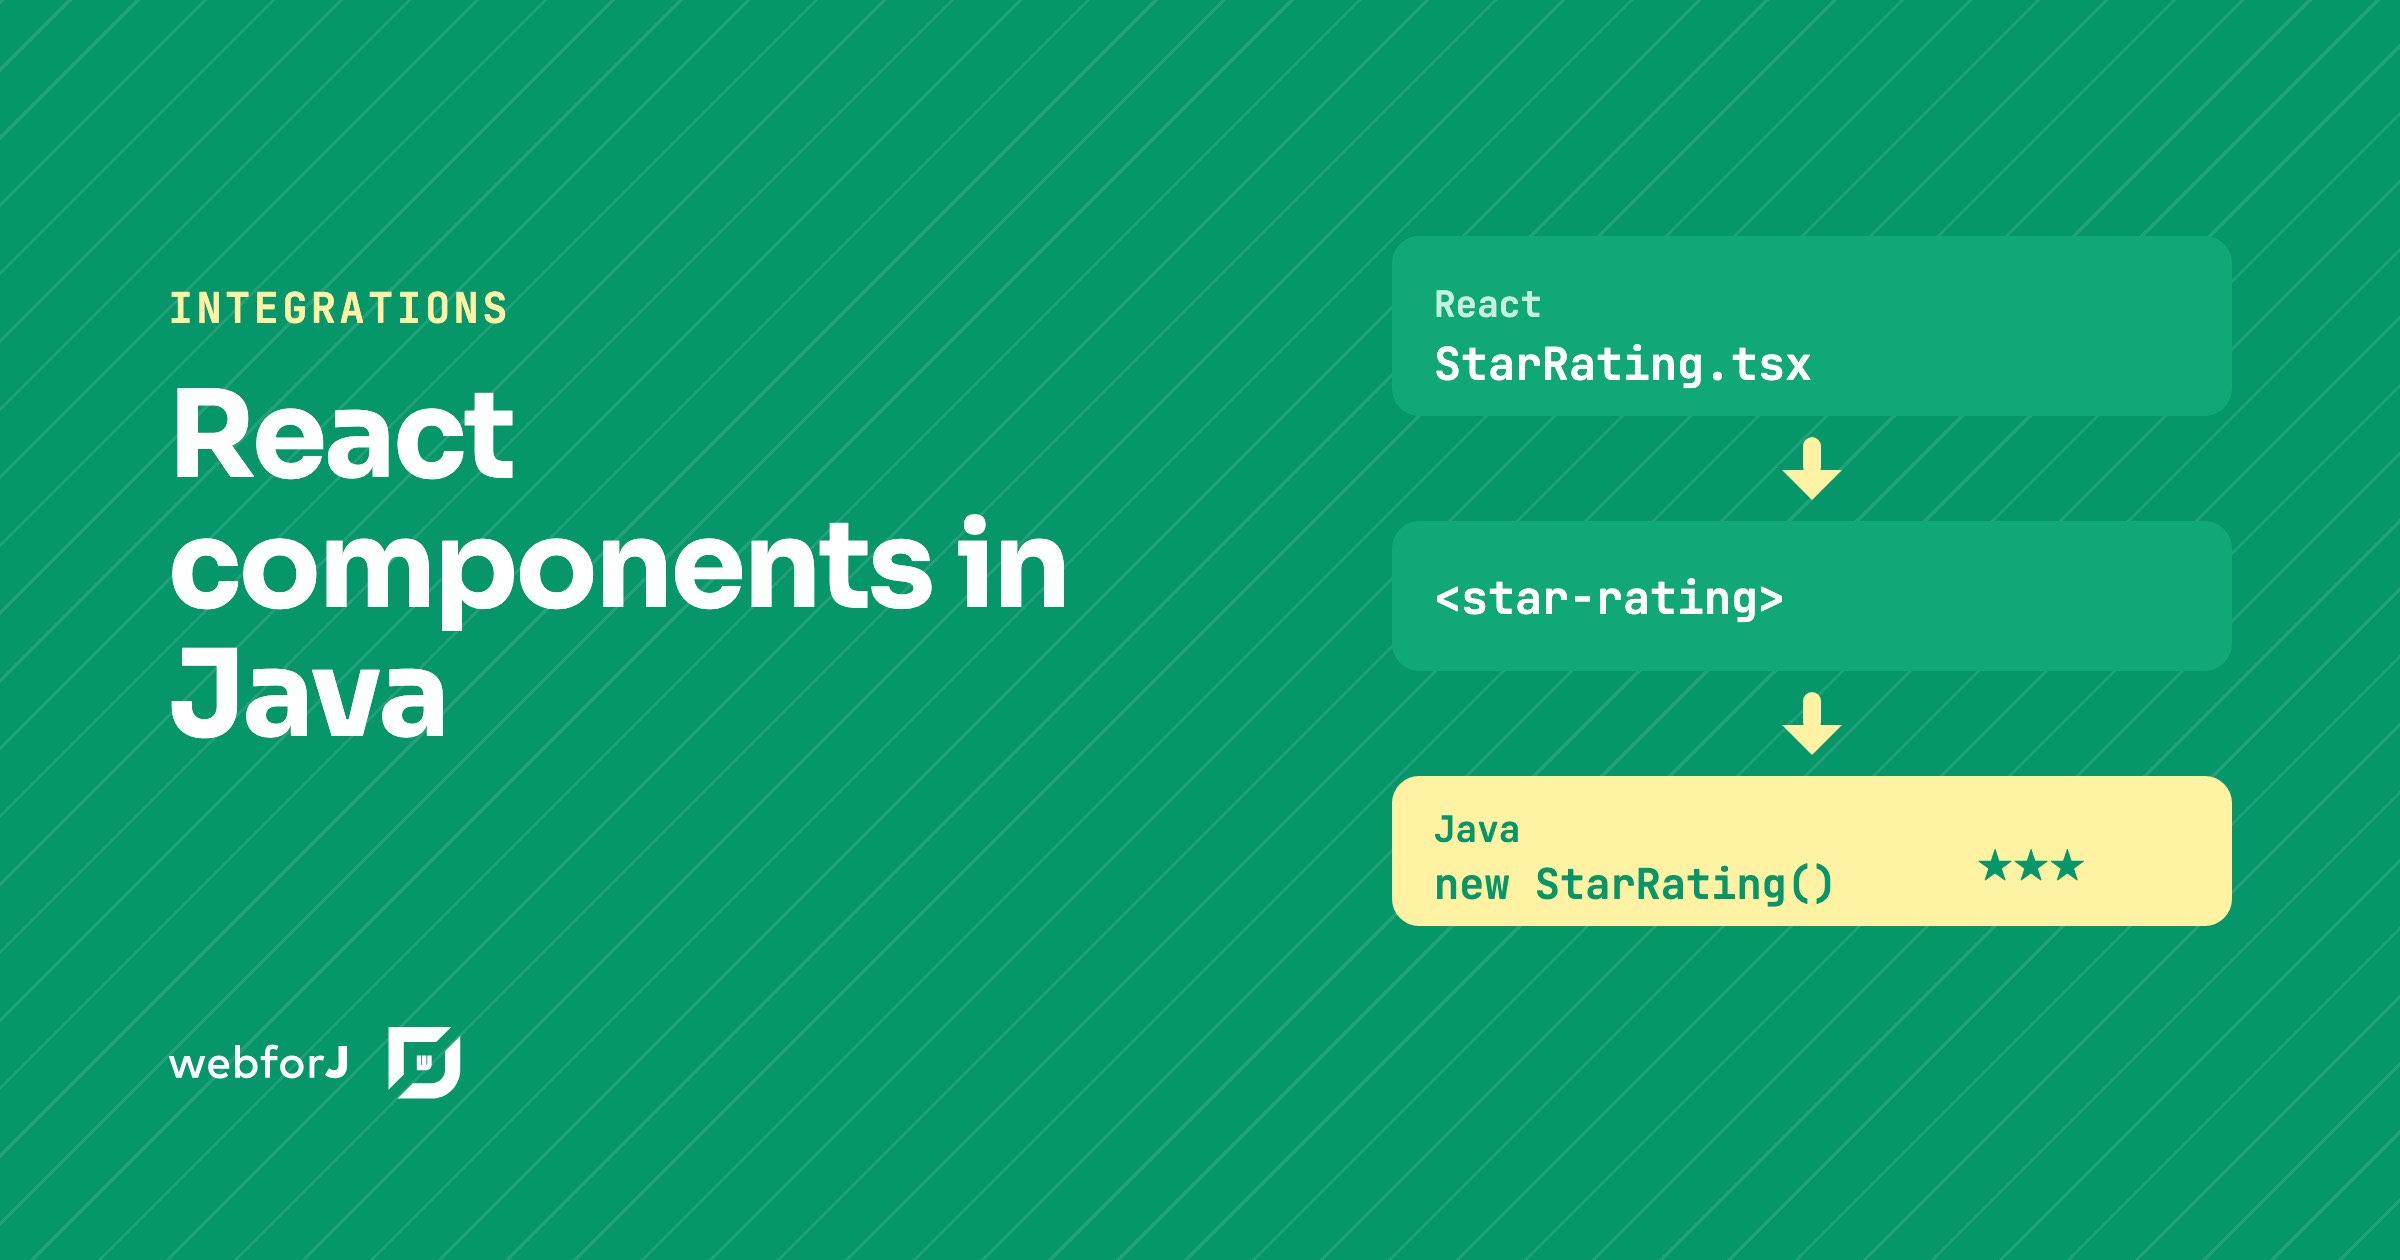 Use a React component in Java: wrap it with webforJUse a React component in Java by turning it into a custom element and wrapping it with ElementComposite. A star rating built step by step in webforJ.
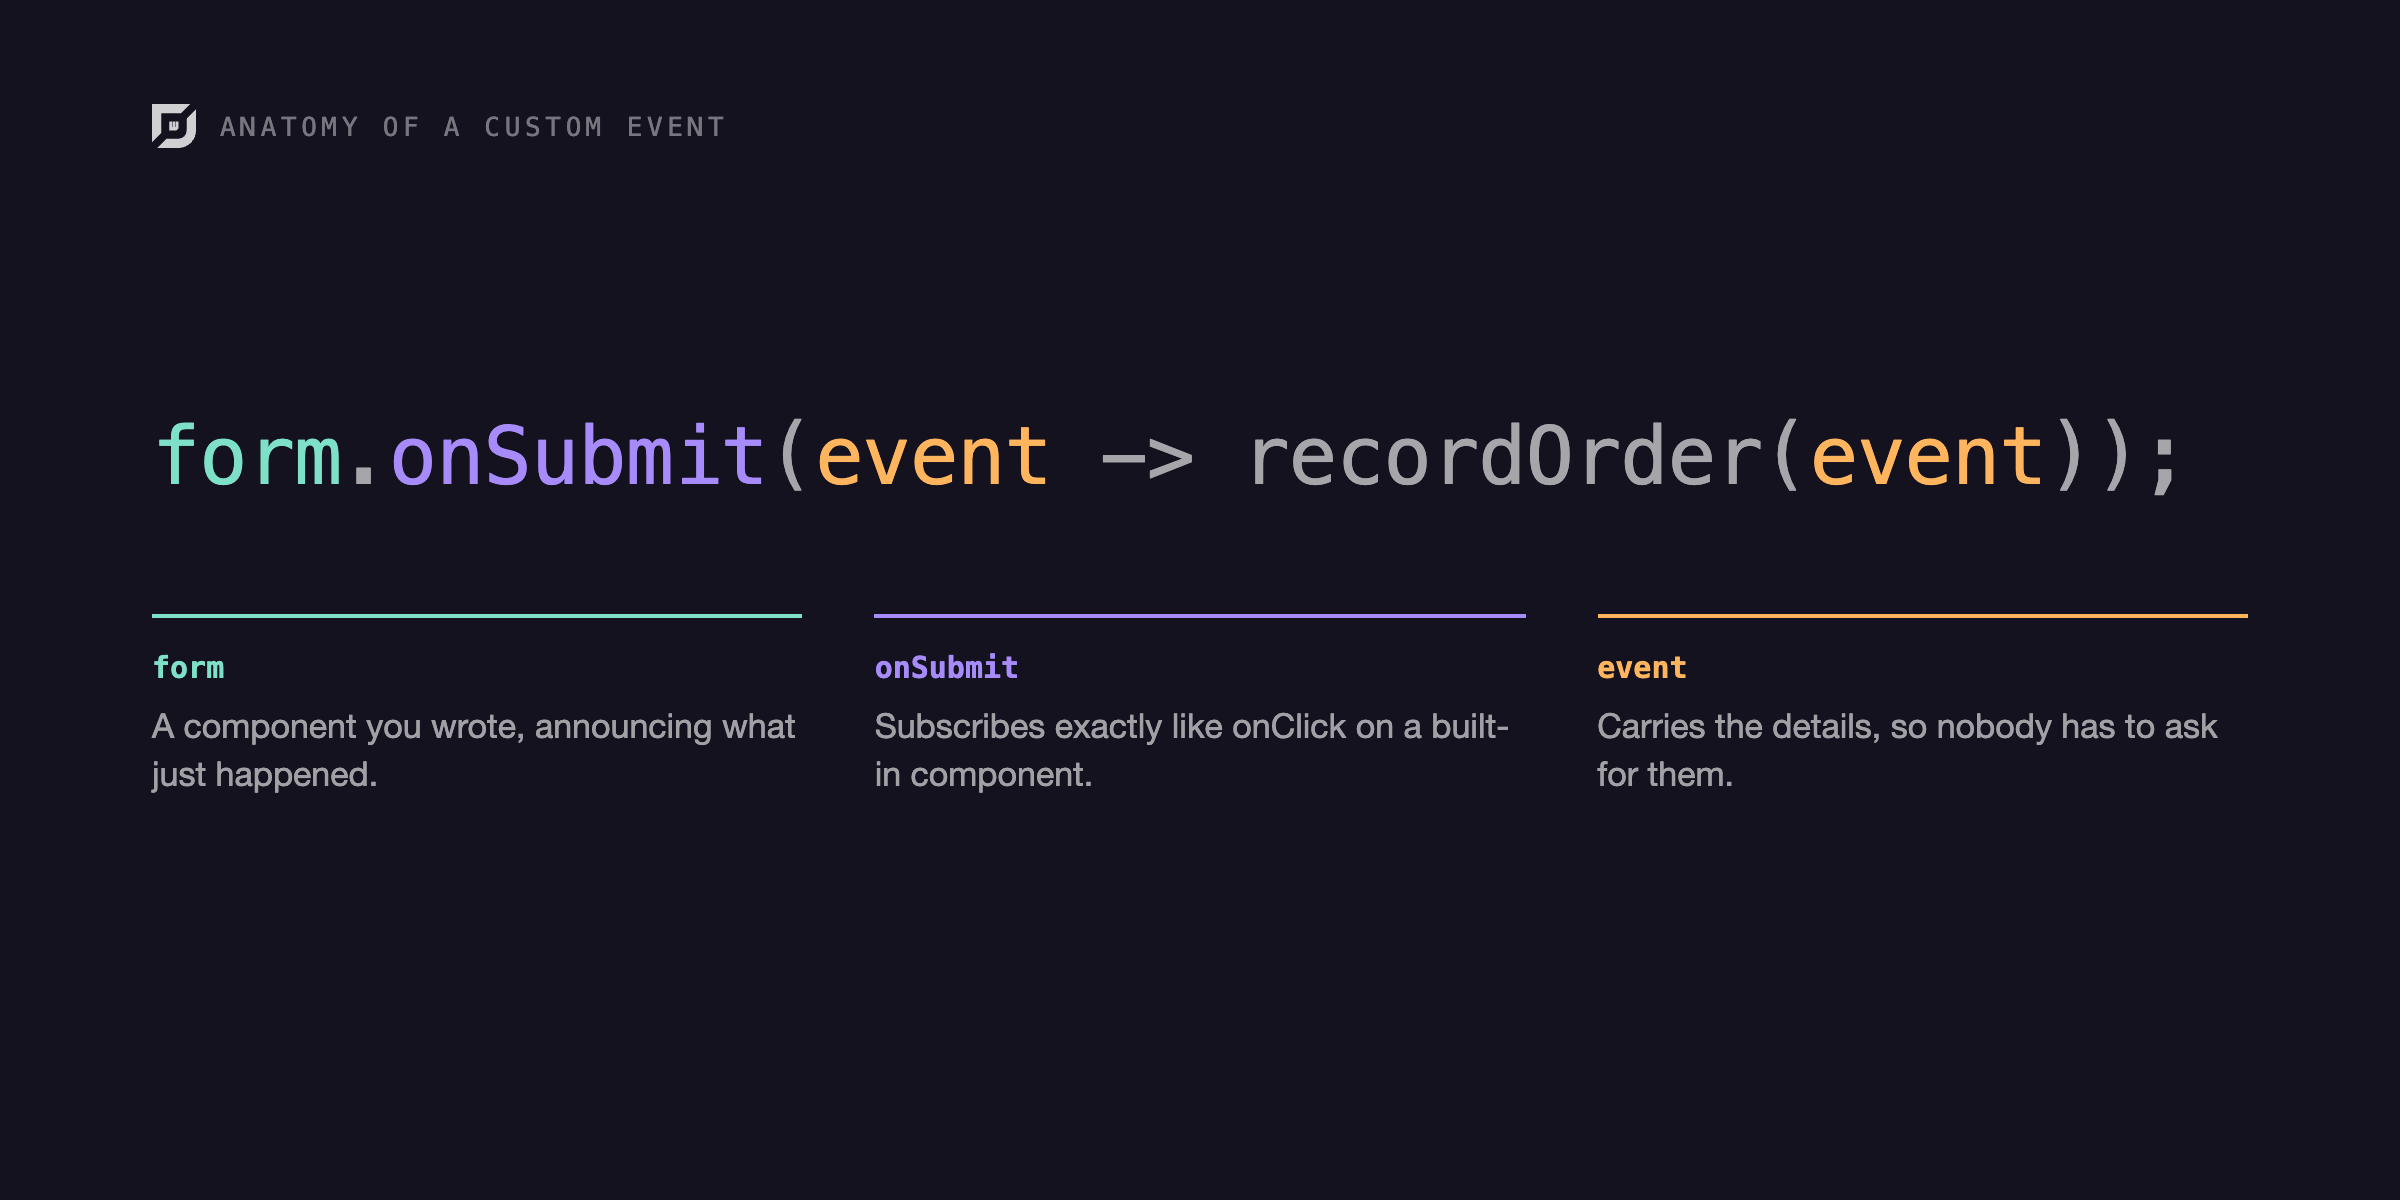 The Demo That Taught Me webforJ EventsBuilding a demo to understand custom events taught me more than writing the docs did, and showed me how much of webforJ's event handling stays in plain Java.
 Java web terminal: embed a terminal in webforJEmbed a Java web terminal in a webforJ app. Write output, handle typed input with onData, and style the Terminal component from server-side Java code.
