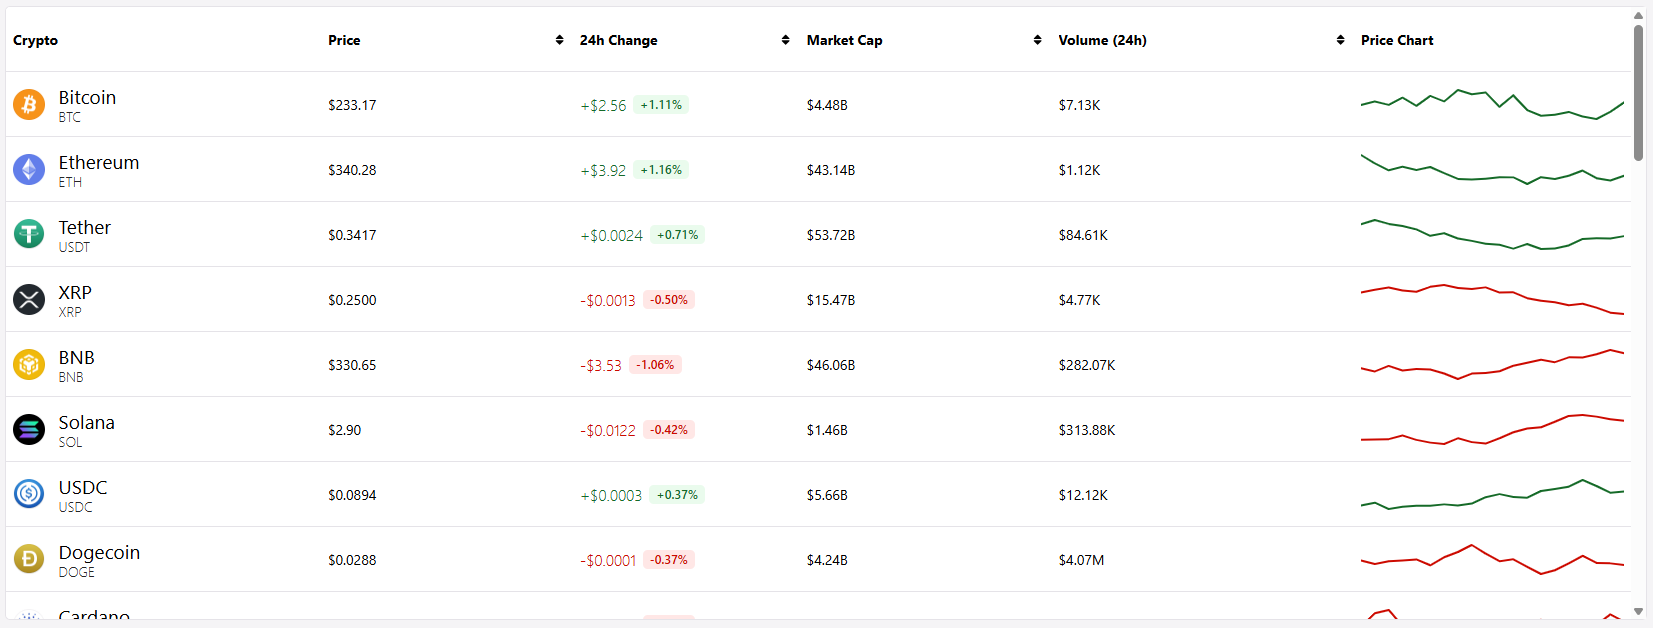
Data is the lifeblood of business applications, and displaying it properly can make or break someone's experience using your app. In order to visualize data, most developers quickly turn to tables for displaying that data. Here's the problem: just throwing information into rows and columns doesn't always tell the story clearly enough.
When users glance at a table, the idea is that they immediately understand what matters. Is that price change good or bad? Which items need attention? What's trending up versus down? If your users have to pause and think, squint at numbers, or do mental math to understand their data, your interface isn't working hard enough for them. Perhaps your first instinct is to say that tables aren't the answer, but that isn't the case.
This is where renderers come in. In webforJ, cell renderers let you transform raw data into visual, instantly understandable information. Earlier this year, I built a mock cryptocurrency dashboard, which is a perfect example of an app that needs quick, understandable information at a glance, since crypto data is fast-moving, emotionally charged, and needs to be digested within seconds. Green numbers for gains, red for losses, formatted prices, inline charts—all rendered dynamically to tell the story your data is trying to communicate.
The fun part was using renderers to contain all of this information inside a tidy table, and in this post, we'll explore when and how to use these renderers to build tables that don't just display data, but actually communicate with your users.